Higher Purpose:
To be a catalyst for connections that inspire curiosity through thoughtful storytelling + meaningful experiences with a sense of place. Giving Back
To be a catalyst for connections that inspire curiosity through thoughtful storytelling + meaningful experiences with a sense of place. Giving Back
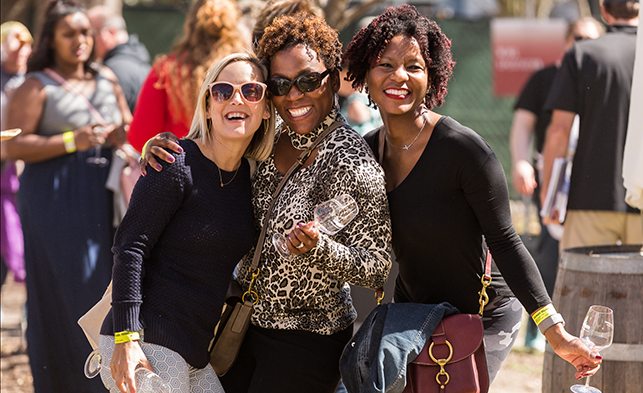
people attended the 2018 festival
74.5% female Average age: 47 90.7% college educated 50.9% reported a household income of $150K + 36.1% reported a household income of $200K +

out of town attendees
Top 5 Origin Metro Areas include: New York, NY Washington, DC Atlanta, GA Charlotte, NC Boston, MA
total website page views *August 1, 2017 – March 31,2017
169,807 unique users Top states: SC, NC, GA, NY, DC
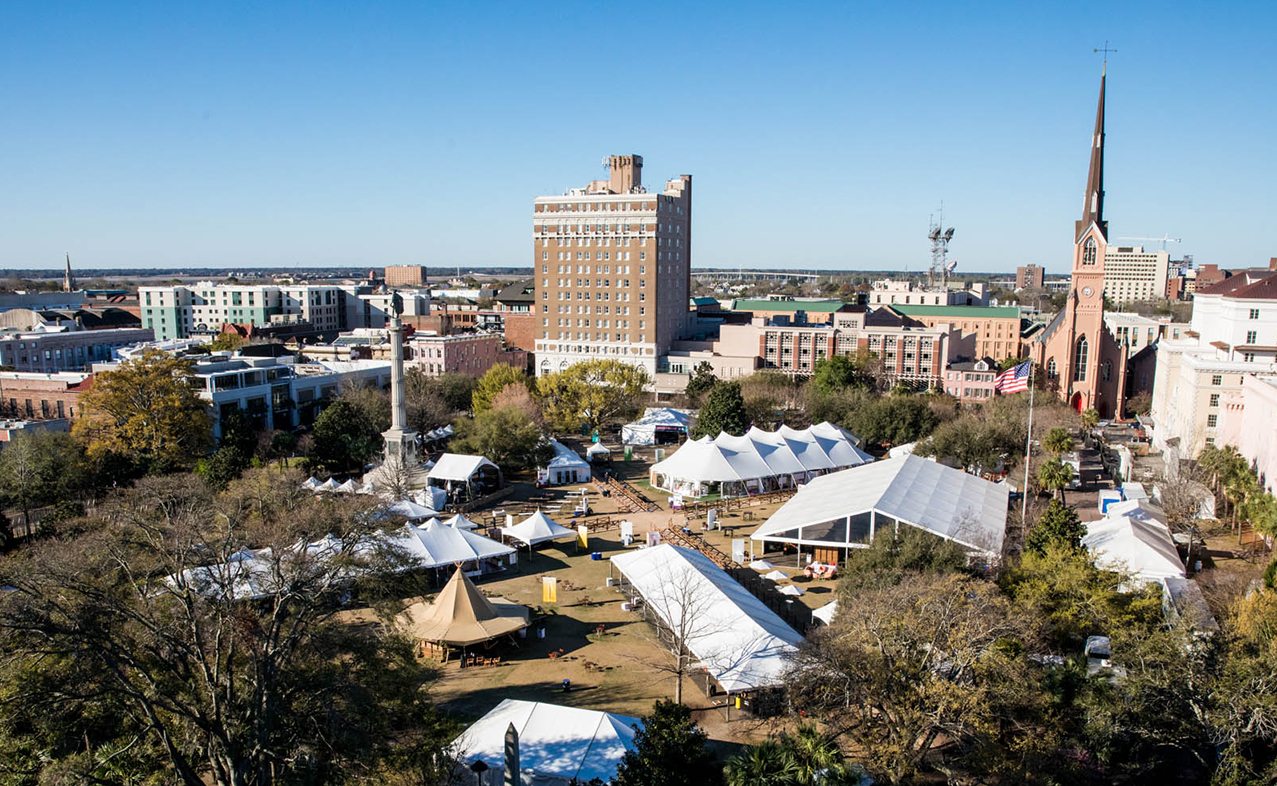
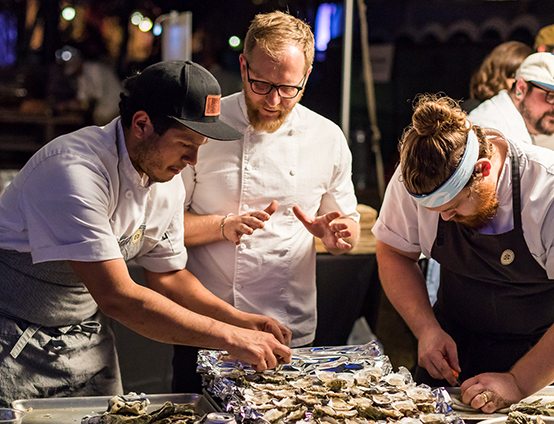
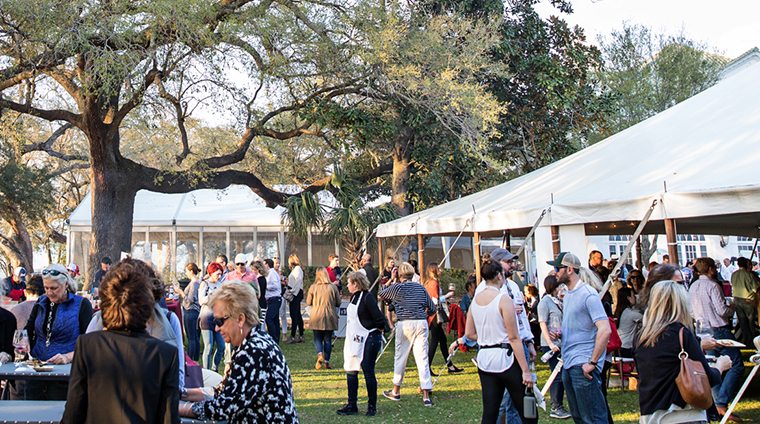
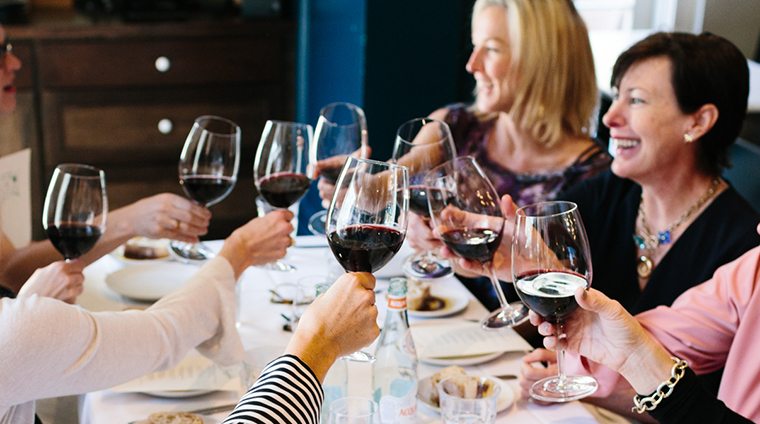
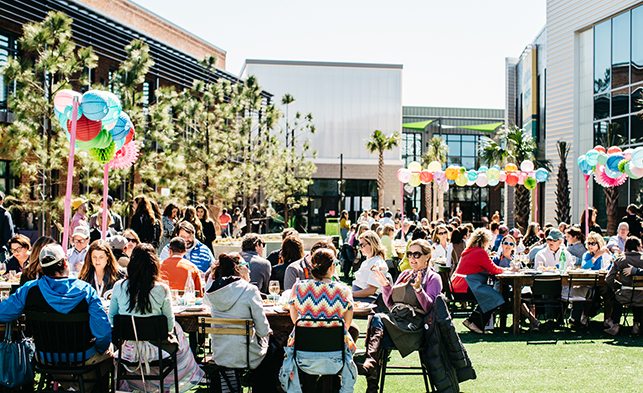
Located in Marion Square, the Culinary Village is the heart + soul of the festival. 3 days 9 Neighborhoods 10,519 Culinary Village guests 189 Chef Demos Get a taste of the Village


Our Partners are an integral part of what we do and who we are here at Charleston Wine + Food. 2018 Partners
NOTE: Attendee data reported in this annual report was obtained via an online survey designed using Qualtrics.com and distributed by College of Charleston Office of Tourism Analysis. The survey was sent via email to all ticket holders who purchased their tickets online. The response rate was 30.4%. Download PDF